The Threadpool in aspnet and performance issues

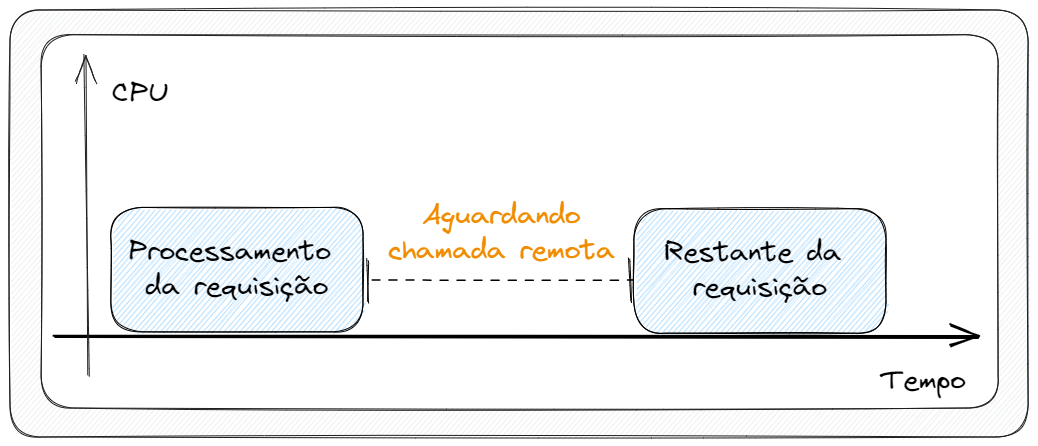
When a request spends most of its time waiting for the result of input and output operations, such as database queries or requests to other APIs, it is considered I/O bound.
Consider the following C# snippet, which executes a database query.
_context.Customers.FirstOrDefault(x => x.Id = id)What happens in this scenario is that the executing thread is blocked while performing the remote call and will only be unblocked when the result of the request is available. Therefore, other requests to this API must run on other threads. If there are no threads available at the moment, the other requests must wait.
To improve the performance of applications of this type, .NET provides the Task type, which represents an operation usually executed asynchronously.
The previous scenario was modified to use asynchronous programming.
await _context.Customers.FirstOrDefaultAsync(x => x.Id = id)When we use async/await the current thread is not blocked as in the previous scenario. Threads are reused instead of blocked, which allows more requests to be processed concurrently. When we use Task and async/await, under the hood a callback is registered and executed when the result of the IO operation returns.
Threadpool starvation
Creating and destroying threads is an expensive process for the operating system. For this reason, .NET provides the threadpool, which is a set of threads that were created and are made available for use. When necessary, new threads can be created by the .NET threadpool, but at a limited rate (one or two per second).
The scenario where the number of tasks waiting for threads to be released grows at a higher rate than that of new thread creation is called threadpool starvation. Requests are queued waiting for their turn to be processed, impacting the application’s performance.
The symptoms of an application in this state are a growing number of threads while CPU capacity is still available. One way to diagnose APIs in a threadpool starvation state is to watch the following metrics:
threadpool-queue-length: the number of work items that are currently queued to be processed in theThreadPoolthreadpool-thread-count: the number of thread pool threads that currently exist in the ThreadPool, based onThreadPool.ThreadCountthreadpool-completed-items-count: the number of work items processed in theThreadPool
The healthy behavior would be a constant number of threads, the queue staying at zero, and a high number of processed items.
Example
As a lab to analyze the performance metrics in both a healthy scenario and a threadpool starvation scenario, two tools will be used:
dotnet-counters: a tool for performance and health analysis of .NET applications. It lets you observe performance counter values.hey: a load generator for web applications.
The code of the test application and the whole tool setup using docker is available on github. The application has two endpoints that execute database calls in an operation lasting 500 milliseconds, to simulate a scenario with higher latency. The sync endpoint uses the synchronous API and the async one the asynchronous API:
[HttpGet("sync")]
public IActionResult GetSync()
{
    _context.Database.ExecuteSqlRaw("WAITFOR DELAY '00:00:00.500'");
    return Ok();
}

[HttpGet("async")]
public async Task<IActionResult> GetAsync()
{
    await _context.Database.ExecuteSqlRawAsync("WAITFOR DELAY '00:00:00.500'");
    return Ok();
}
To start the application and the monitoring with dotnet-counters, the following commands must be run:
docker compose up app
docker exec -it thread-pool-test-app dotnet-counters monitor -n dotnet
The load test using the sync endpoint:
docker compose up send-load-syncThe simplified result of the load test and a snapshot of dotnet-counters are presented below.
 Summary:
   Total:    27.2940 secs
   Slowest:  5.1772 secs
   Fastest:  0.5020 secs
   Average:  2.6085 secs
   Requests/sec:     36.6380
[System.Runtime]
% Time in GC since last GC (%) 0
Allocation Rate (B / 1 sec) 2,987,784
CPU Usage (%) 0
Exception Count (Count / 1 sec) 0
GC Committed Bytes (MB) 0
GC Fragmentation (%) 0
GC Heap Size (MB) 109
Gen 0 GC Count (Count / 1 sec) 0
Gen 0 Size (B) 0
Gen 1 GC Count (Count / 1 sec) 0
Gen 1 Size (B) 0
Gen 2 GC Count (Count / 1 sec) 0
Gen 2 Size (B) 0
IL Bytes Jitted (B) 797,595
LOH Size (B) 0
Monitor Lock Contention Count (Count / 1 sec) 11
Number of Active Timers 3
Number of Assemblies Loaded 152
Number of Methods Jitted 10,503
POH (Pinned Object Heap) Size (B) 0
ThreadPool Completed Work Item Count (Count / 1 sec) 55
ThreadPool Queue Length 74
ThreadPool Thread Count 36
Time spent in JIT (ms / 1 sec) 0.656
Working Set (MB) 232The load test using the async endpoint:
docker compose up send-load-asyncThe results:
 Summary:
   Total:   5.5532 secs
   Slowest: 1.0283 secs
   Fastest: 0.5011 secs
   Average: 0.5272 secs
   Requests/sec:    180.0777
[System.Runtime]
% Time in GC since last GC (%) 0
Allocation Rate (B / 1 sec) 4,458,328
CPU Usage (%) 0
Exception Count (Count / 1 sec) 0
GC Committed Bytes (MB) 0
GC Fragmentation (%) 0
GC Heap Size (MB) 114
Gen 0 GC Count (Count / 1 sec) 0
Gen 0 Size (B) 0
Gen 1 GC Count (Count / 1 sec) 0
Gen 1 Size (B) 0
Gen 2 GC Count (Count / 1 sec) 0
Gen 2 Size (B) 0
IL Bytes Jitted (B) 825,928
LOH Size (B) 0
Monitor Lock Contention Count (Count / 1 sec) 10
Number of Active Timers 3
Number of Assemblies Loaded 152
Number of Methods Jitted 10,947
POH (Pinned Object Heap) Size (B) 0
ThreadPool Completed Work Item Count (Count / 1 sec) 1,384
ThreadPool Queue Length 0
ThreadPool Thread Count 30
Time spent in JIT (ms / 1 sec) 3.467
Working Set (MB) 236Comparing the two versions, it is possible to see that the sync version has slow calls caused by the request’s waiting time to be processed. During the whole test the ThreadPool Queue Length remained high.
The async version has an average call time close to 500 milliseconds, which is the expected time for each request, and the ThreadPool Queue Length stays close to 0 during the test. The ThreadPool Completed Work Item Count is much higher compared to the sync scenario.
Conclusion
Asynchronous programming, by reusing threads instead of blocking them, makes it possible to increase the number of requests that IO bound applications can process. In .NET this is done using async/await.
In a real application it may not be simple to identify blocking operations that can lead to performance problems in a scenario with a large number of requests. For that, the dotnet-counters tool combined with a load test can be used to diagnose possible thread starvation scenarios.