Diagnostics using dotnet-monitor + prometheus + grafana
In my last post I wrote about the Threadpool Starvation problem and the use of dotnet-counters to obtain performance metrics from a .NET application. In this article, dotnet-monitor will be used as the tool to obtain several pieces of diagnostic information from .NET applications. The focus will be on application performance metrics, and to make visualization easier, the prometheus and grafana pair will be used.
For the article, a lab was created using docker compose and the code can be found on github.
dotnet-monitor
dotnet-monitor is a monitoring tool for production environments capable of collecting artifacts such as dumps, traces, logs and metrics. The tool exposes an API that makes on-demand diagnostic information extraction available.
The .NET runtime exposes a service endpoint for inter-process communication called the diagnostic port. The technology used depends on the platform. On Linux, Unix domain sockets are used as the transport. That is how dotnet-monitor communicates with .NET applications. In the lab, the application and the monitor run in different containers, so the monitor must share a volume with the application.
# docker-compose.yml
  app:
    ...
    environment:
      DOTNET_DiagnosticPorts: /app/diag/dotnet-monitor.sock
    volumes:
      - "./:/app/"
  monitor:
    image: mcr.microsoft.com/dotnet/monitor:6
    environment:
      DOTNETMONITOR_Storage__DefaultSharedPath: /diag
      DOTNETMONITOR_DiagnosticPort__ConnectionMode: listen
      DOTNETMONITOR_DiagnosticPort__EndpointName: /diag/dotnet-monitor.sock
    volumes:
      - "./diag:/diag"
    ...
It is possible to run the application and the monitor with the command:
docker compose up appThe metrics endpoint exports values in the Prometheus-compatible format and can be accessed at http://localhost:52325/metrics.
Prometheus
Prometheus is an open source monitoring tool capable of collecting and storing metrics as time series data.
The following configuration is used for the lab:
# prometheus/prometheus.yml
scrape_configs:
  ...
  - job_name: "monitor"
    scrape_interval: 5s
    metrics_path: "/metrics"
    static_configs:
      - targets: ["monitor:52323"]
This way, when starting the container using docker compose, prometheus will connect to dotnet-monitor to collect the metrics.
It is possible to browse and visualize the metrics in the Prometheus interface, but we will use it as a data source for another tool focused on visualization.
Grafana
Grafana is an open source visualization and monitoring tool that allows the creation of dashboards. It can use several technologies as data sources, including Prometheus.
Another interesting point about grafana is the large number of community dashboards available that can be used as a base for monitoring systems and applications. For the lab we will use the dotnet-monitor dashboard.
The grafana configuration for the lab could be done manually via the GUI, but to make reproduction easier we will use provisioning files to automate the setup.
The Prometheus configuration as a data source is done in the file:
# grafana/provisioning/datasources/default.yaml
datasources:
  - name: Prometheus
    type: prometheus
    access: proxy
    # Access mode - proxy (server in the UI) or direct (browser in the UI).
    url: http://prometheus:9090
    jsonData:
      httpMethod: POST
      manageAlerts: true
      prometheusType: Prometheus
      prometheusVersion: 2.44.0
      cacheLevel: "High"
      disableRecordingRules: false
      incrementalQueryOverlapWindow: 10m
And the configuration to allow dashboard provisioning is done in the file:
# grafana/provisioning/dashboards/default.yaml
providers:
  - name: "default"
    folder: ""
    type: file
    options:
      path: /var/lib/grafana/dashboards
Each dashboard must have its JSON definition placed in the path defined in the previous file.
The docker-compose file maps the volumes to the default configuration directories expected by grafana.
# docker-compose.yml
  grafana:
    image: grafana/grafana-oss
    ports:
      - "3000:3000"
    volumes:
      # https://grafana.com/docs/grafana/latest/administration/provisioning/
      - "./grafana/provisioning/:/etc/grafana/provisioning/"
      - "./grafana/dashboards/:/var/lib/grafana/dashboards/"
The next command runs grafana and prometheus:
docker compose up grafanaGrafana can be accessed at http://localhost:3000 (use admin/admin to log in).
Load tests
Lastly, we can run the load tests using hey.
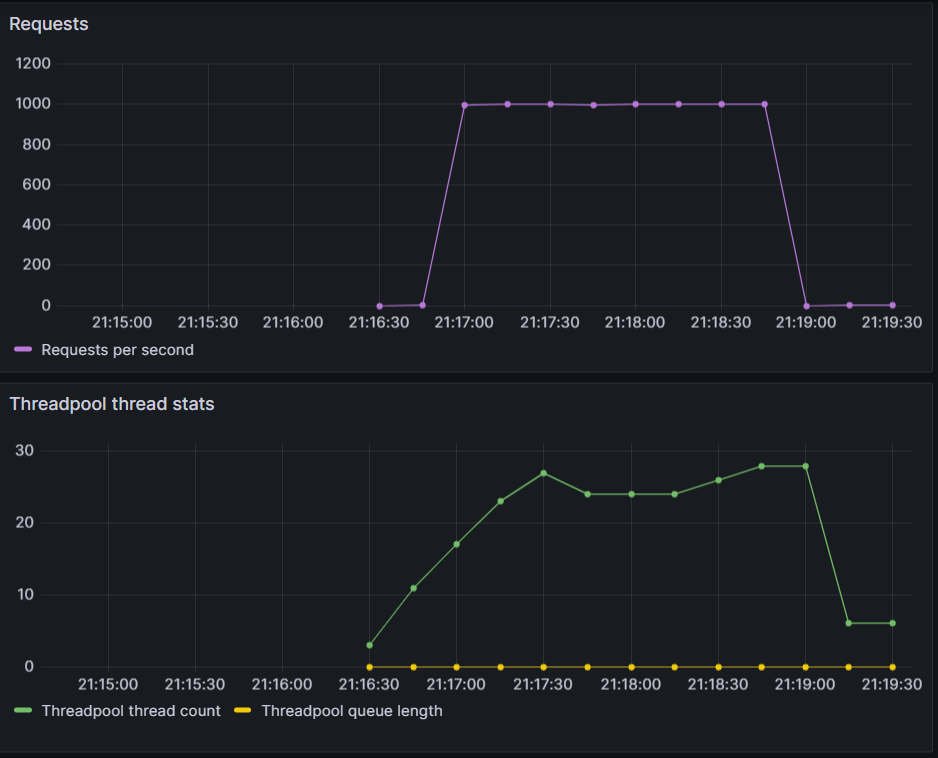
The command docker compose up send-load-async fires a series of requests at an endpoint that uses .NET’s async/await to take advantage of thread reuse and optimize IO bound applications. The graphs below show the number of requests processed during the test execution as well as the metrics related to thread usage by the application.
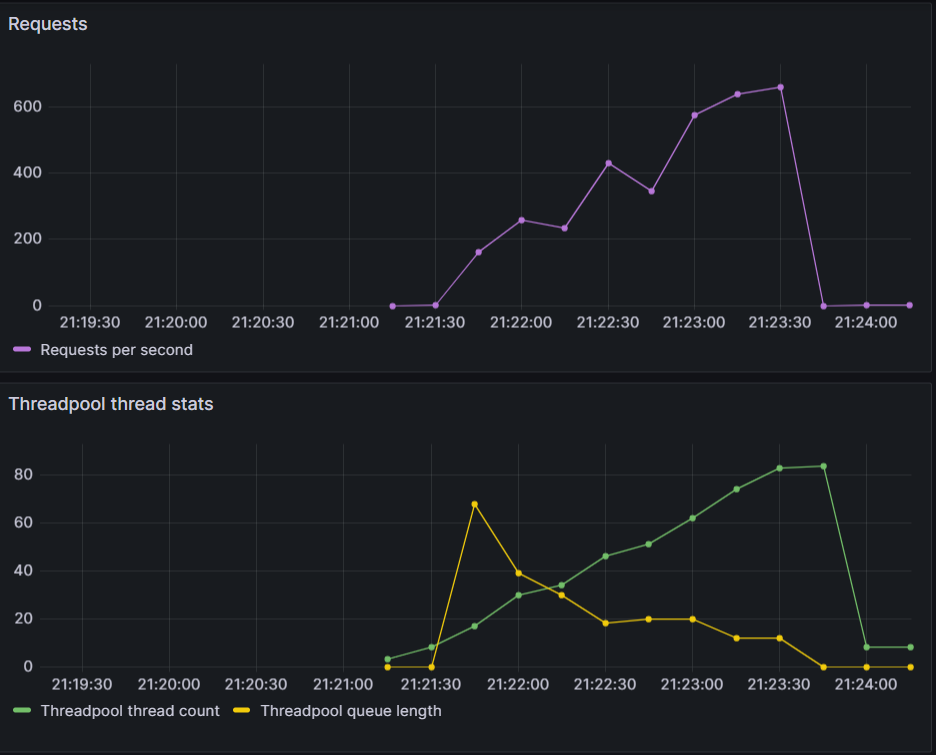
In turn, the command docker compose up send-load-sync sends requests to an endpoint that does not use async/await and therefore blocks threads on IO operations. The graphs below show the test result.
Conclusion
The tests performed show the potential of dotnet-monitor for monitoring applications in production environments. The tests were done using docker compose, and the configuration to run on kubernetes is similar, with the monitor being published as a sidecar of the application.
As important as extracting the metrics is the ability to visualize and correlate that data to enable the diagnosis of performance problems. The prometheus and grafana pair was used for that purpose because they are well-known tools in the market and they make reproduction in a local environment easy for a lab.